Distributed telemetry platform (EdgePulse)
CorePulse
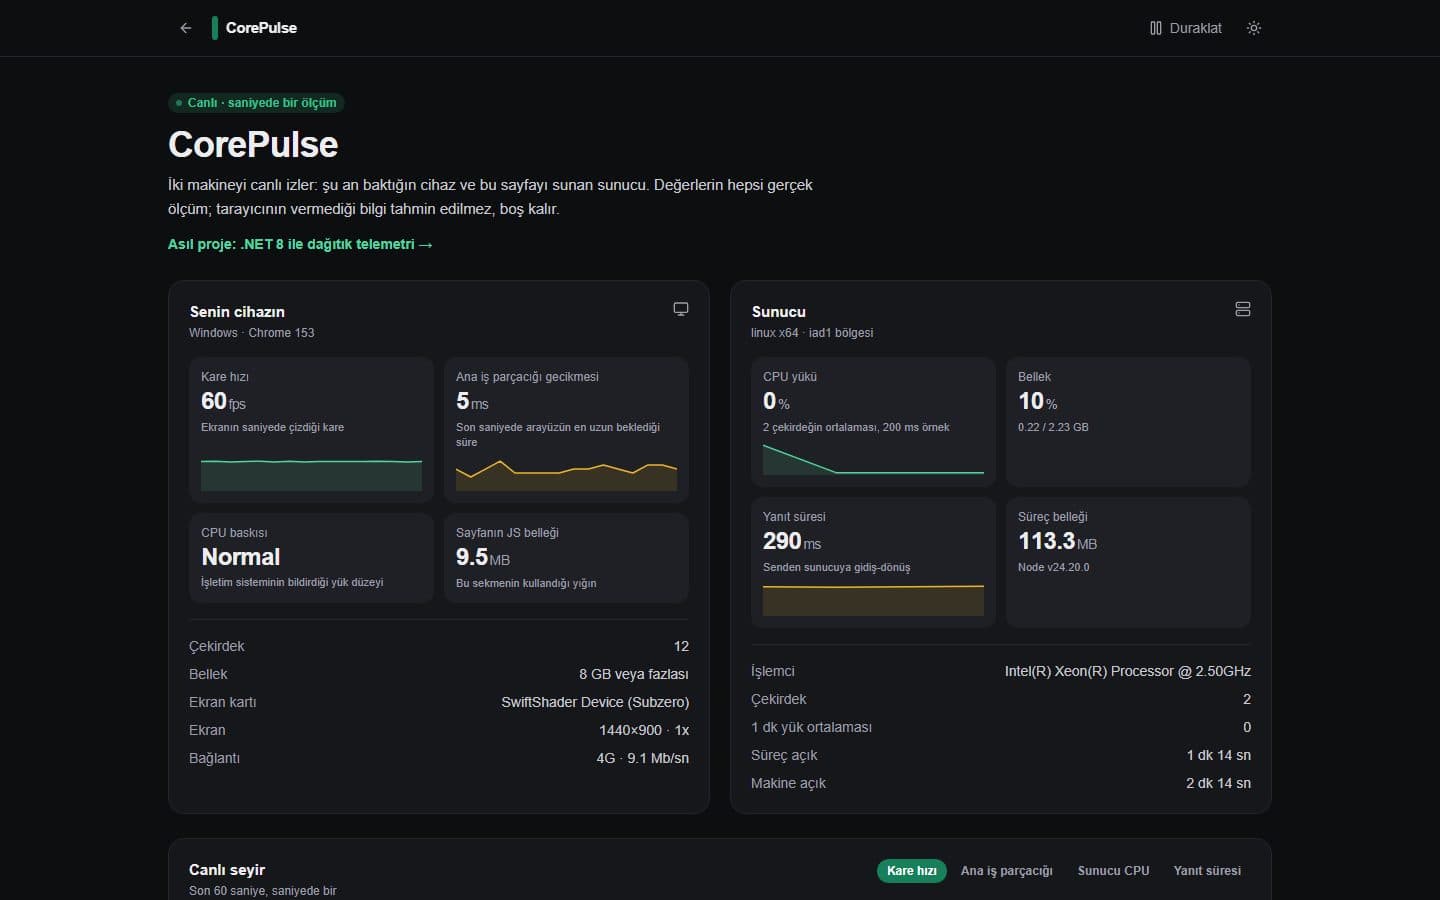
EdgePulse is a distributed telemetry platform that collects CPU, memory and uptime from machines and raises alerts the moment a threshold is crossed. CorePulse is its live web demo in this portfolio, showing the server’s and the visitor’s own hardware in real time.
- Status
- Live
- Tools
- .NET 8 · ASP.NET Core · RabbitMQ · SignalR · PostgreSQL · Angular 17 · Docker · Next.js
The problem
Collecting telemetry is easy; the hard part is moving readings without loss, evaluating alerts without slowing ingestion and pushing results to the UI instantly. The aim was to build these as decoupled services.
My role
Sole developer: service architecture, .NET services, the collector agent, the Angular UI and the portfolio web demo.
Approach
- 01
Event pipeline
Collector agent → YARP gateway (.NET 8) → Telemetry.API (ASP.NET Core 8) → RabbitMQ → Alert.Worker → SignalR → Angular. The queue decouples ingestion from alert evaluation, so one slowing down doesn’t stall the other.
- 02
Rule-based alerting
A .NET 8 Worker Service evaluates configurable per-metric thresholds and pushes alerts to open dashboards over a SignalR hub; data lives in PostgreSQL 16.
- 03
Offline-tolerant agent
The Node.js collector queues readings locally when the gateway is unreachable and flushes them once it’s back. The whole stack starts with a single Docker Compose command.
- 04
The live portfolio demo
So it runs with zero setup, the CorePulse page is built on Next.js: a route handler reads CPU and memory from Node’s os module, the visitor’s GPU is detected via WebGL, charts are SVG, and a server-side stress test runs on demand.
The hard part
One reading says nothing
The OS reports CPU times cumulatively since boot, so a single reading can’t show current load. The previous reading is kept in memory and load is computed from the idle/total delta between consecutive readings; the first reading only records a baseline.